The proof we have on file
Everything on this page comes from a document or video in our possession that names Magnetizer. One-page documents are shown in full; every figure links to the page of the report it comes from, or to the minute of the video where it is said.
Results shown are manufacturer test data or results reported by Magnetizer Inc.; every figure links to its source. Results vary.
1. Customer letter and press
Open full size · Download PDF
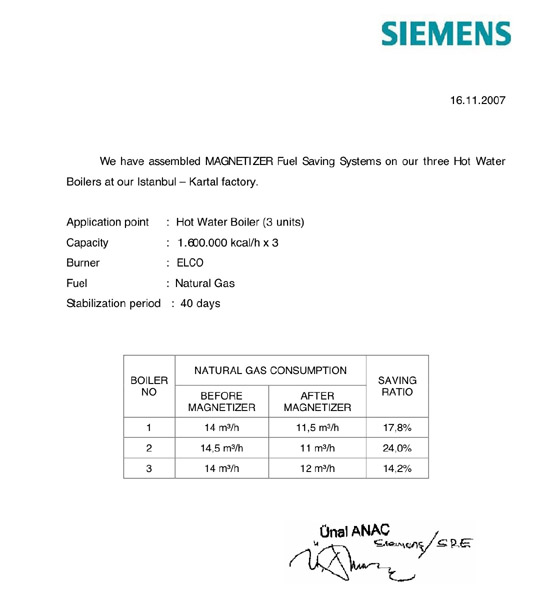
“We have assembled MAGNETIZER Fuel Saving Systems on our three Hot Water Boilers at our Istanbul – Kartal factory.” Three 1,600,000 kcal/h natural-gas boilers, ELCO burners, 40-day stabilization period.
Natural gas consumption before / after, per the letter: boiler 1 — 14 to 11.5 m³/h (17.8%); boiler 2 — 14.5 to 11 m³/h (24.0%); boiler 3 — 14 to 12 m³/h (14.2%). Average saving 18.6%. Signed Ünal Anaç.

Open full size
The Military Engineer, Nov–Dec 1993
The journal of the Society of American Military Engineers — an engineering trade journal, so this is commercial and institutional water and fuel systems, not a home product review. The cover reads: “Featured inside: The Magnetizer Group, Inc. — Water & Fuel Systems.”
Source: cover image only. The article text is not on file, so nothing from it is quoted here.
2. Video testimonials — New York Hilton (commercial installation)
Two short interviews recorded by Magnetizer with the New York Hilton’s engineering staff about the units on the hotel’s commercial building water systems (cooling tower, chiller plant, heat exchanger, water supply). This is commercial-scale evidence, not a home installation. Neither video states a percentage saving, so we don’t either.
3. Manufacturer test data — the 23-page report
Magnetizer Inc. compiled its fuel and emissions tests into one document. We have re-saved it as a searchable PDF: Magnetizer Fuel Test Data, 23 pages (PDF). The headline numbers, each linked to its page:
All fuel figures above are manufacturer test data taken from that report (or, for Siemens, from the letter shown). They are single tests on specific engines and boilers; results vary.
Every test in the report, page by page (each entry links to its page)
- Comparison table, patents RE 35689 and 5,829,420, CARB executive order EOD-174-3, US military stock number NSN 2910-01390-0004 — pp. 1–2
- Before / after hydrocarbon and carbon-monoxide table for about 40 vehicles (Chevy, Ford, Nissan, BMW, VW, Hyundai and others; some entries from Boston Gas Company, Guatemala, Argentina and Malaysia) — pp. 2–3
- Certified-test bullet list: VTEC 26%; Institute of Aeronautics (Poland) CO −40%, HC −20%; RV Power Group 5.34 to 8.08 mpg; Bacon Equipment +33% tractor horsepower; Penske +4.8%; Chile EPA 18%; Tomei Industrial Furnace (Taiwan) 11.7% less heavy oil; Northern California Diagnostic Laboratories +5% horsepower; US Border Patrol test 8/10/95 (27.0%, 29.8%, 10.3%, 50.8% on four vehicles); Electrometal Ltd 7/31/95 genset 25% diesel; Wheels Ltd 11/04/95 rental cars +17.46% and +18.0%; City of Berkeley CA fleet 14.13%, 2.46%, 7.06% — pp. 4–5
- Certified-tests summary: Beijing Railroad 4.88–5.91%; United States Air Force 80% smoke reduction, +50% CO and HC reduction on petrol vehicles with catalytic converters; US Postal Service CA +8% fuel; US Federal Border Patrol +10% fuel; SIRIM Malaysia 5% fuel, CO −40%; EPA Latin America 18.8%; Sri Lanka 60% opacity; Mercedes-Benz, Nissan, Proton, Ford/VW emission reductions — p. 5
- United States Air Force, Air Force Material Command, Management & Equipment Evaluation Program (MEEP), Hurlburt Field, Florida: two petrol vehicles and one diesel bus over six months; conclusion “demonstrated the ability to reduce harmful emissions in both petrol and diesel engines”; recommended for Air Force use and a national stock number was assigned — pp. 6–7
- Chilean EPA CVS-75 test, 1990 Chevy LUV 1600: 8.50 to 10.10 km/l, 18.8% — pp. 7–9
- Mercedes-Benz Argentina S.A., 10 Nov 1993, diesel bus: CO 0.09 to 0.04 (600 rpm), HC 30 to 12 — p. 9
- Guatemala, Nissan Dicorsa plant, 13 Apr 1991: five vehicles, idle and 2,500 rpm CO / HC before and after — p. 10
- SIRIM Malaysia, Proton 1.5S, June 1993: HC 130 to 100, CO 2.0 to 1.4, power 58 to 59 kW — p. 11
- Penske dyno, 17 Feb 1989: average 609.2 to 614 hp (+4.8%) — p. 11
- VTEC Laboratories generator test: about 26% lower fuel flow at constant load — pp. 12–14
- Autolatina (Ford / VW) Argentina, 13 Oct 1993: gasoline consumption down 17% — pp. 14–15
- SIRIM Malaysia, 20 May 1999: Proton Iswara 1.3S −3.29% fuel, +6.6% power; Proton Perdana 2.0i −6.62% fuel; Kia Sportage 2.0 −6.11% fuel, +2.3% power — pp. 15–17
- Sri Lanka EPA, 17 May 1999: pickup one opacity 30.1 to 11.8 HSU (60.7%); pickup two 56.4 to 21.7 HSU (61.2%) — pp. 17–18
- Nepal, April–May 1999: seven petrol vehicles average CO −83.12%, HC −38.97%; seven diesel vehicles average smoke −61.13% — pp. 18–19
- China Academy of Railway Science, Tung Fong 4 locomotive, June 1996 – March 1997: average 4.88% (5.91% in April 1997, peak 9.11%); softer carbon on injectors — p. 19
- CREA-PA Brazil, Scania bus, 1 May – 7 June 2003: 2.874 to 3.452 km/l, 20.11% — p. 20
- Transporte São Luiz, Brazil, Oct–Nov 2003 tachograph analysis: about 9.36% — p. 20
- 1983 Ford F-100 teardown at 158,000 miles with units fitted since 41,000 miles: clean water jacket, no carbon on valves or pistons — p. 21
- California emissions test, 2001: HC −84%, CO −83%, NOx −72%; stabilization period 200–500 miles — pp. 22–23
Download the full report (PDF, 23 pages)
4. A customer’s own mileage log
Open full size · Download PDF
A customer’s own mileage log
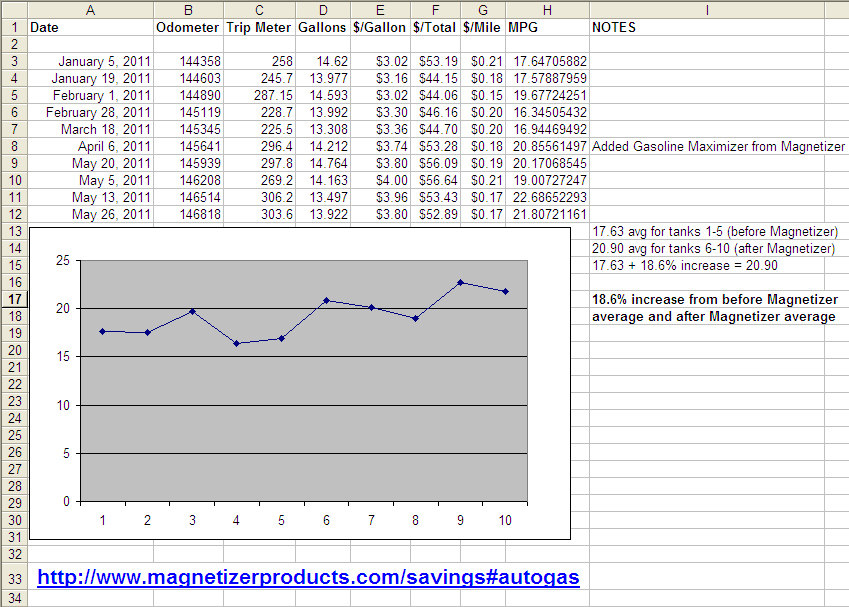
A customer’s fuel spreadsheet, January to May 2011: ten fill-ups, with the Gasoline Performance Maximizer added before tank six. Average 17.63 mpg for tanks 1–5, 20.90 mpg for tanks 6–10 — an 18.6% increase (mileage log PDF).
5. All the videos
6. Dated case studies reported by Magnetizer Inc.
These eight customer results were published by Magnetizer Inc. with a date and place. We do not hold the original letters, so they are labelled accordingly, carry no source link, and are kept separate from the documents above.
Natural gas heating — 5 buildings, Canada and USA, 1997–2002
“The average fuel consumption per degree-day with Magnetizer treatment was reduced by 17%. The estimated average savings was $20,000. This particular installation had one time cost of $6,354.”
“1998/99 vs. 1996/97: 13.3% reduction in natural gas used. 1998/99 vs. 1997/98: 12.6% reduction in natural gas used (adjusted for degree days).”
“The saving achieved of 8.3% based on an average energy consumption of $120,000.”
“This comparison shows a decrease of 9.73 cubic meters per degree-day. Percentage of saving 7.5%. Our treatment is only on the heating boilers. These boilers consume 58% of the building’s total cubic meters. Therefore 7.5% divided by 58% consumption factor gives an overall 12.9% savings.”
“Multi unit apartment building powered by natural gas benefited an energy savings of 10.97% based upon available data for previous years.”
“The savings in natural gas as a result of the installation of magnets was 11.95% in 2001-2002 when compared to 2000-2001.”
Fuel oil boilers — Scarsdale Manor, 1997
“Both boilers showed yearly fuel savings of 17% and 19% respectively. The yearly savings was $17,855 with cost of Magnetizer equipment of $3,716.”
Water-side scale and chemicals — University of California, 1991
“Saved $4,200 yearly on elimination of chemicals, acid treatments, drilling, and maintenance. ROI in 2 months.”
References & documents
Documents (PDF)
- Magnetizer Fuel Test Data (23 pages) — the manufacturer’s compilation of fuel-economy and emissions tests, 1989–2003; every number on this page cites a page in it PDF
- Siemens letter, 16.11.2007 (1 page) — natural-gas consumption before and after on three factory boilers PDF · image
- Customer mileage log, Jan–May 2011 (1 page) — ten fill-ups before and after fitting the Gasoline Maximizer PDF · image
- The Military Engineer, Nov–Dec 1993 (cover only) — “Featured inside: The Magnetizer Group, Inc.” image
- Cars, Trucks, Trains & Buses data sheet (1 page) — Gasoline, Diesel and Motorcycle units: benefits, applications, technical principles PDF · image
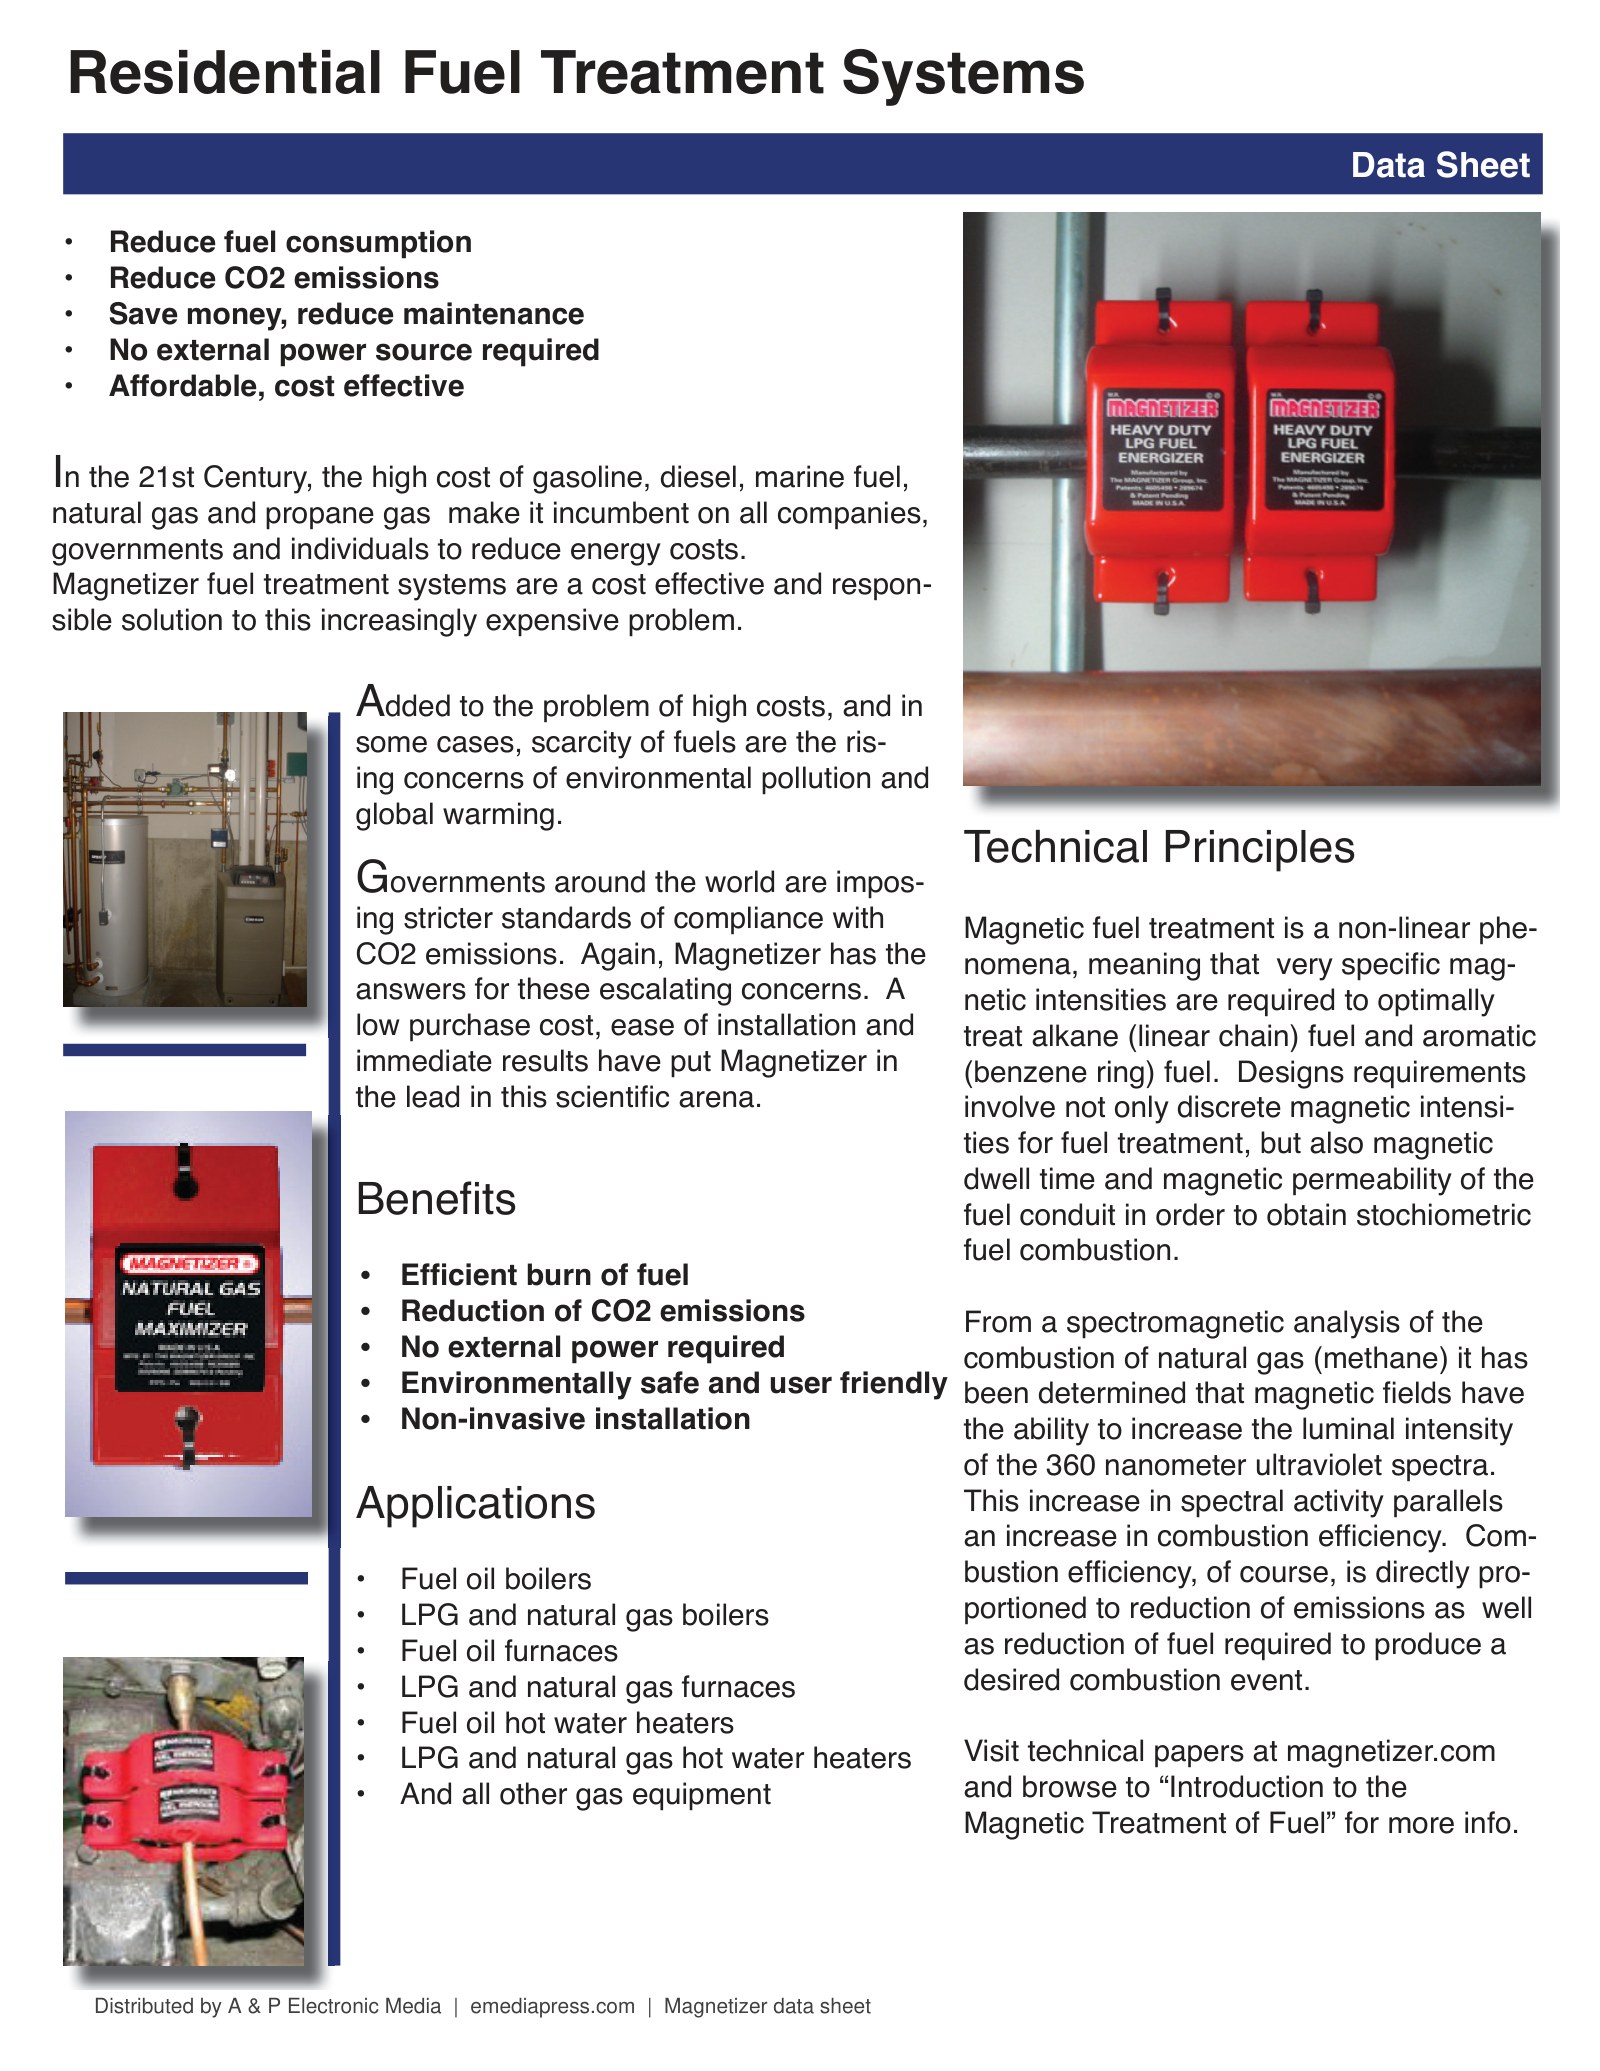
- Residential Fuel Treatment data sheet (1 page) — Natural Gas, LPG and Fuel Oil home units PDF · image
- Residential Water Treatment data sheet (1 page) — Home Hard Water Conditioner PDF · image
- Pool & Spa Water Treatment data sheet (1 page) — Pool & Spa Conditioner PDF · image
- Flav-O-Ring product sheet (1 page) — Flav-O-Ring product sheet (footer contact line removed) PDF · image
- Agricultural Crop Booster data sheet (1 page) — Agricultural Crop Booster (industrial, quoted) PDF · image
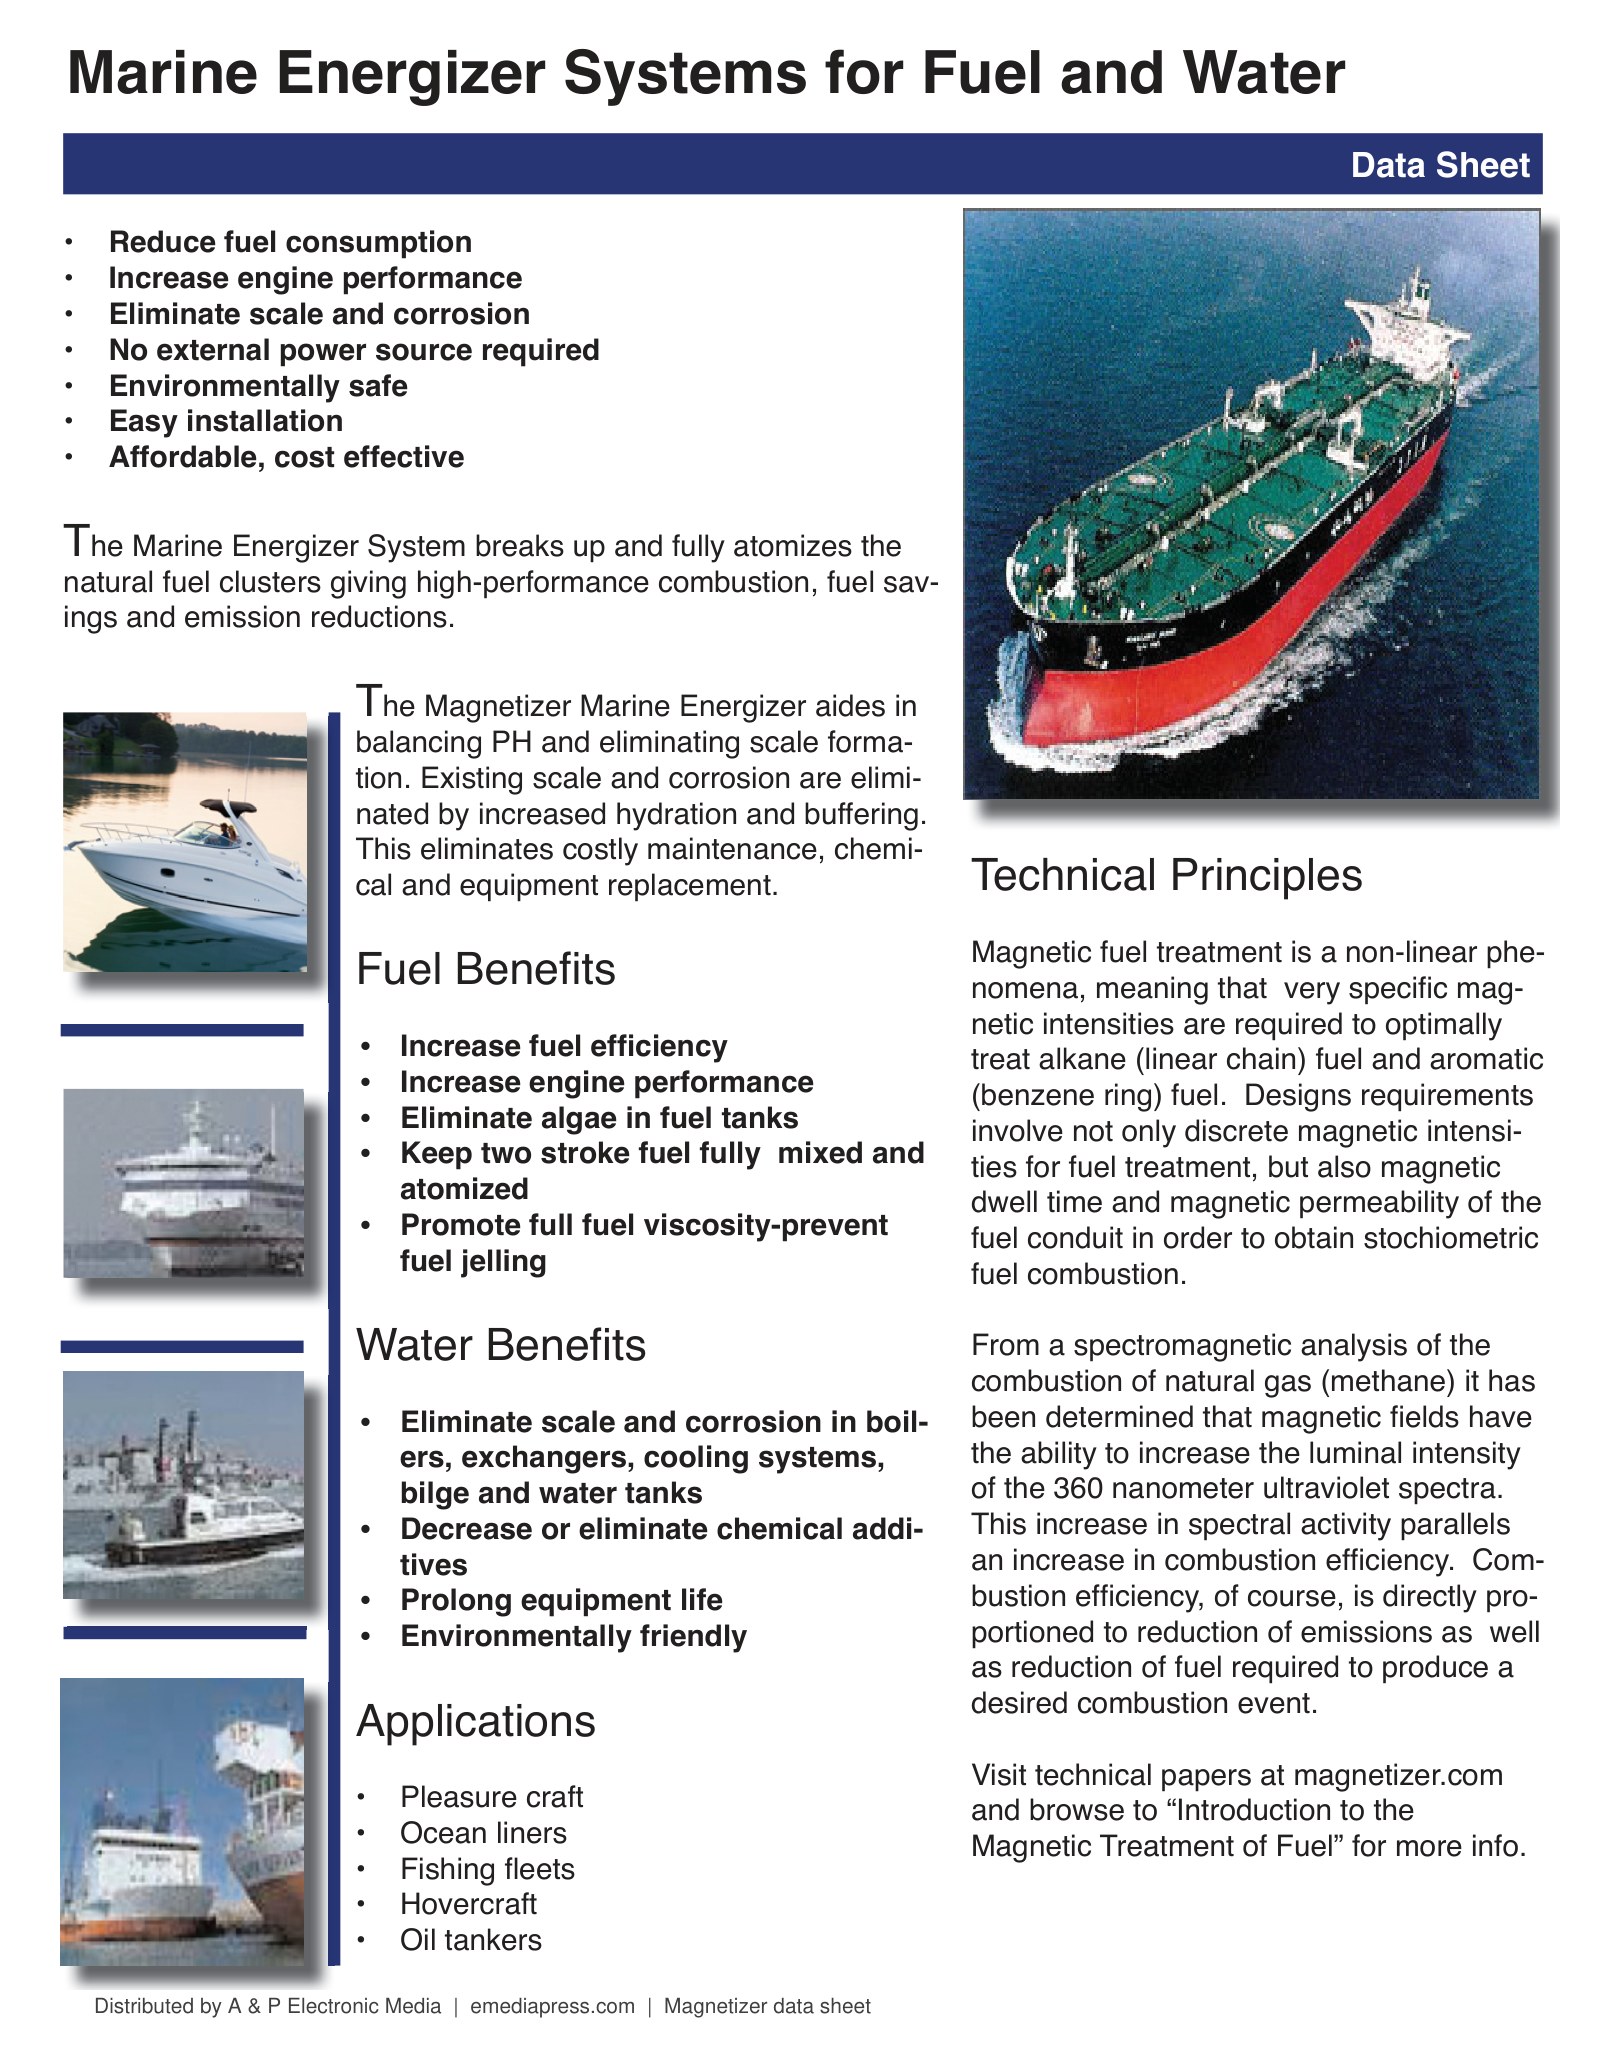
- Marine Energizer Systems data sheet (1 page) — Marine Energizer Systems (industrial, quoted) PDF · image
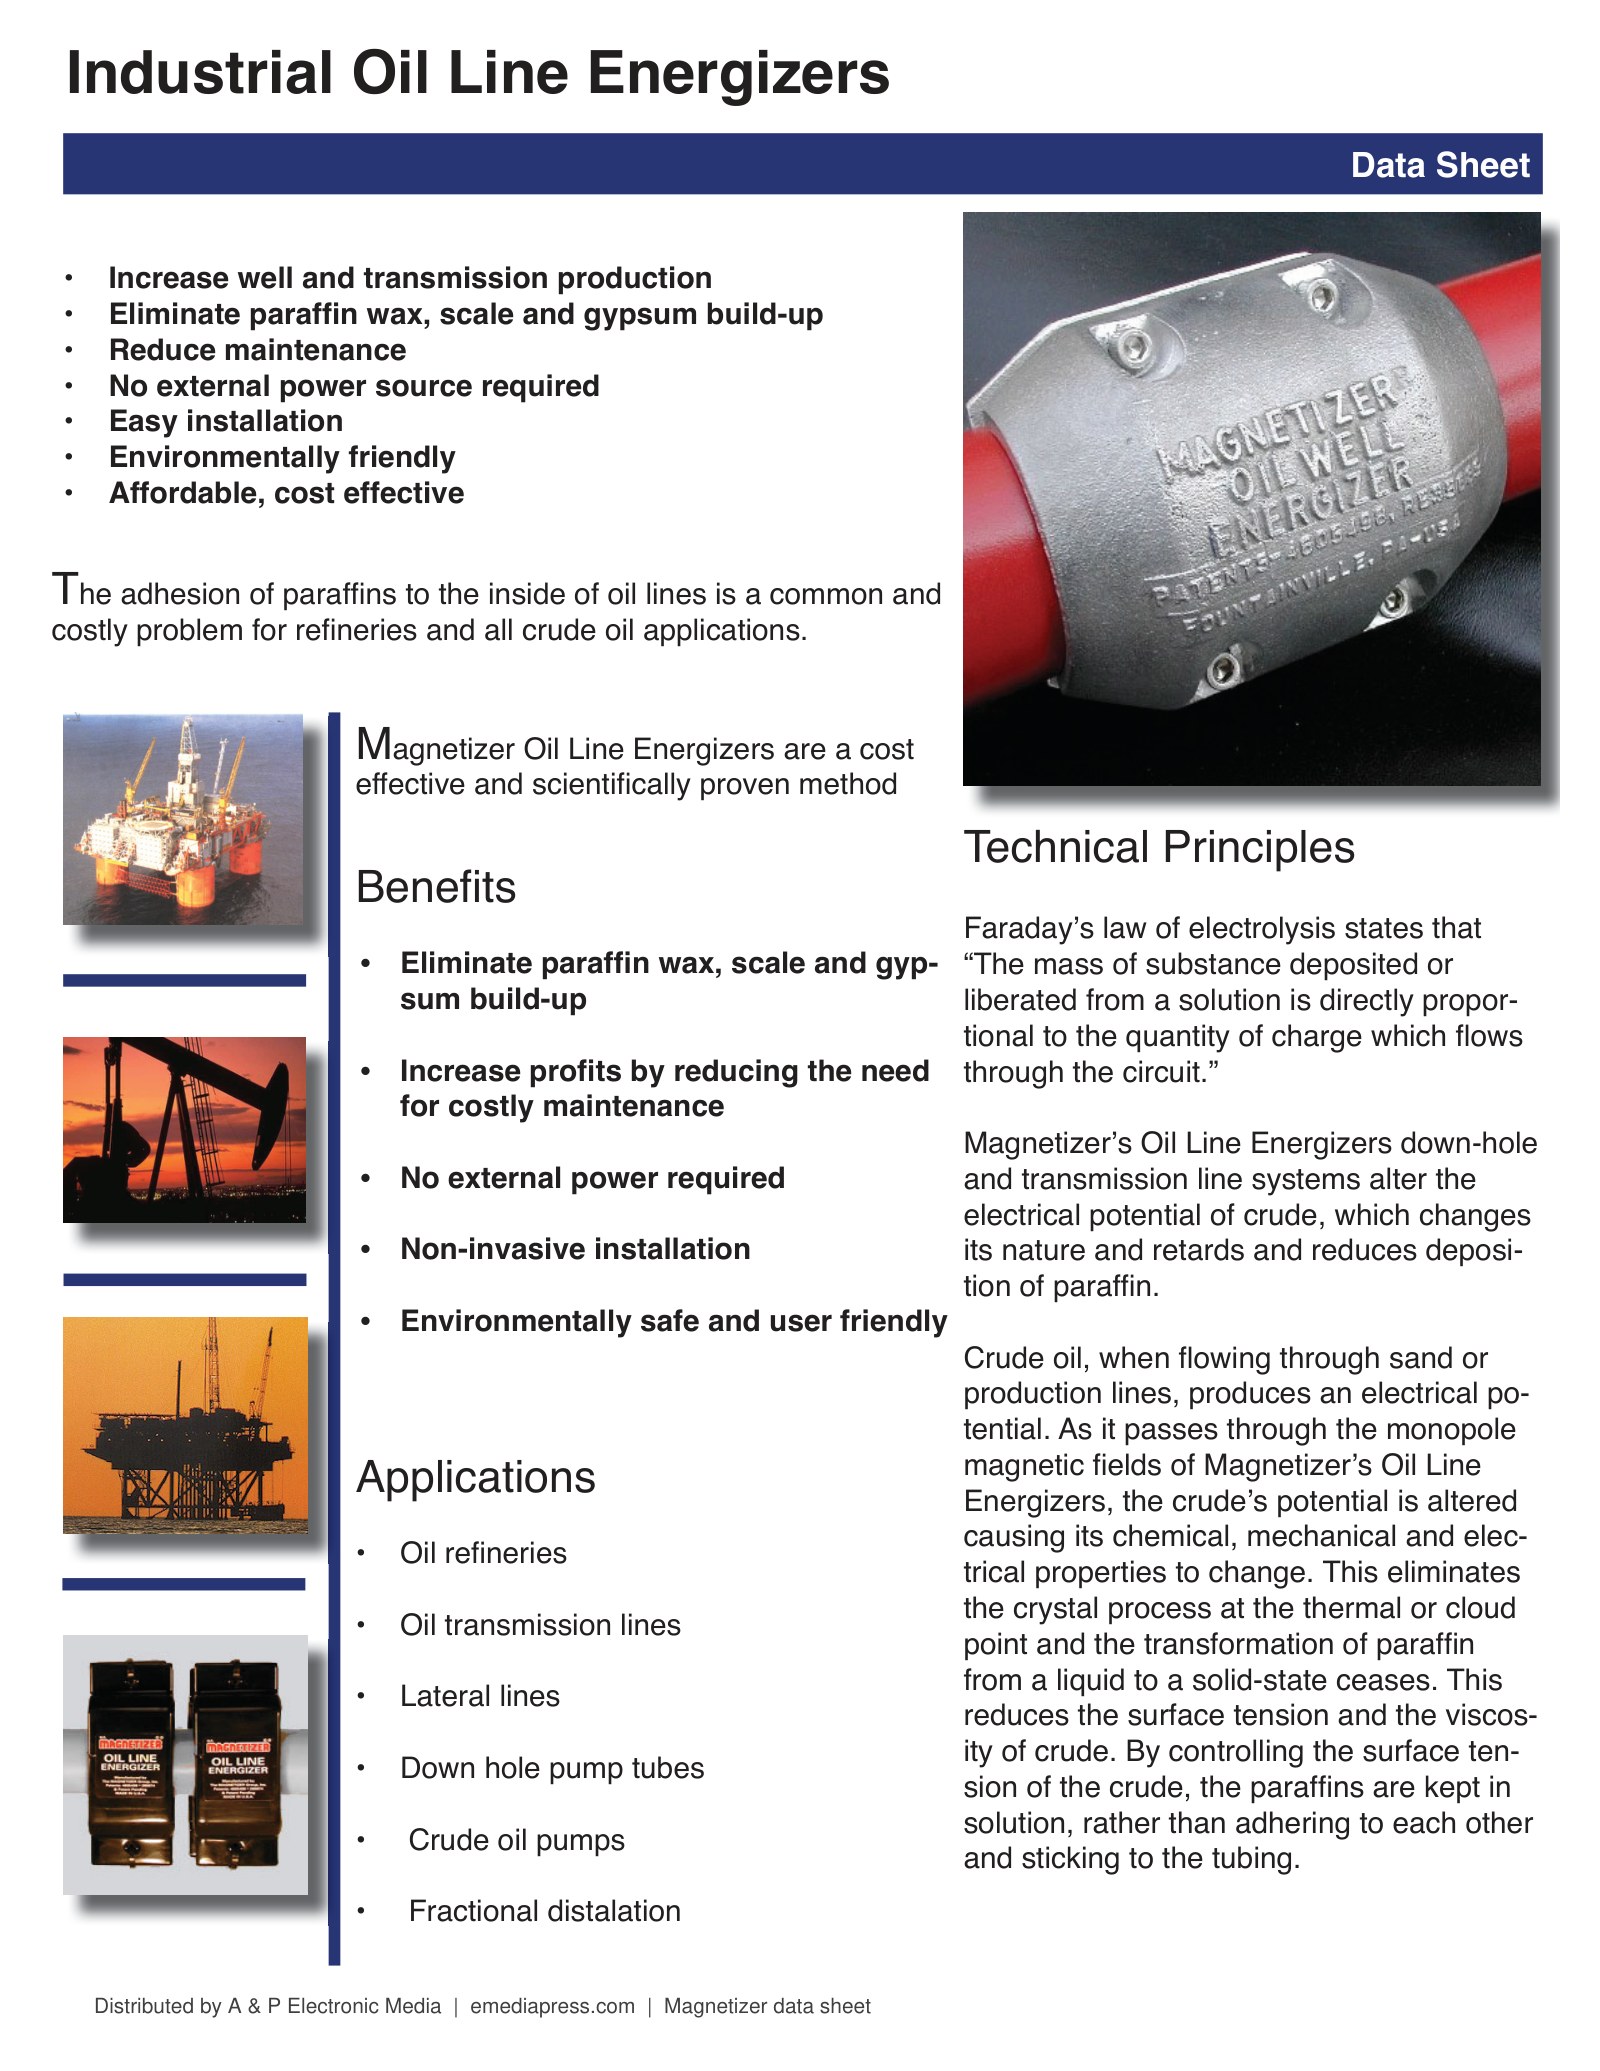
- Industrial Oil Line Energizers data sheet (1 page) — Industrial Oil Line Energizers (industrial, quoted) PDF · image
- Commercial / Industrial Water Treatment data sheet (1 page) — Commercial / Industrial Water Treatment (industrial, quoted) PDF · image
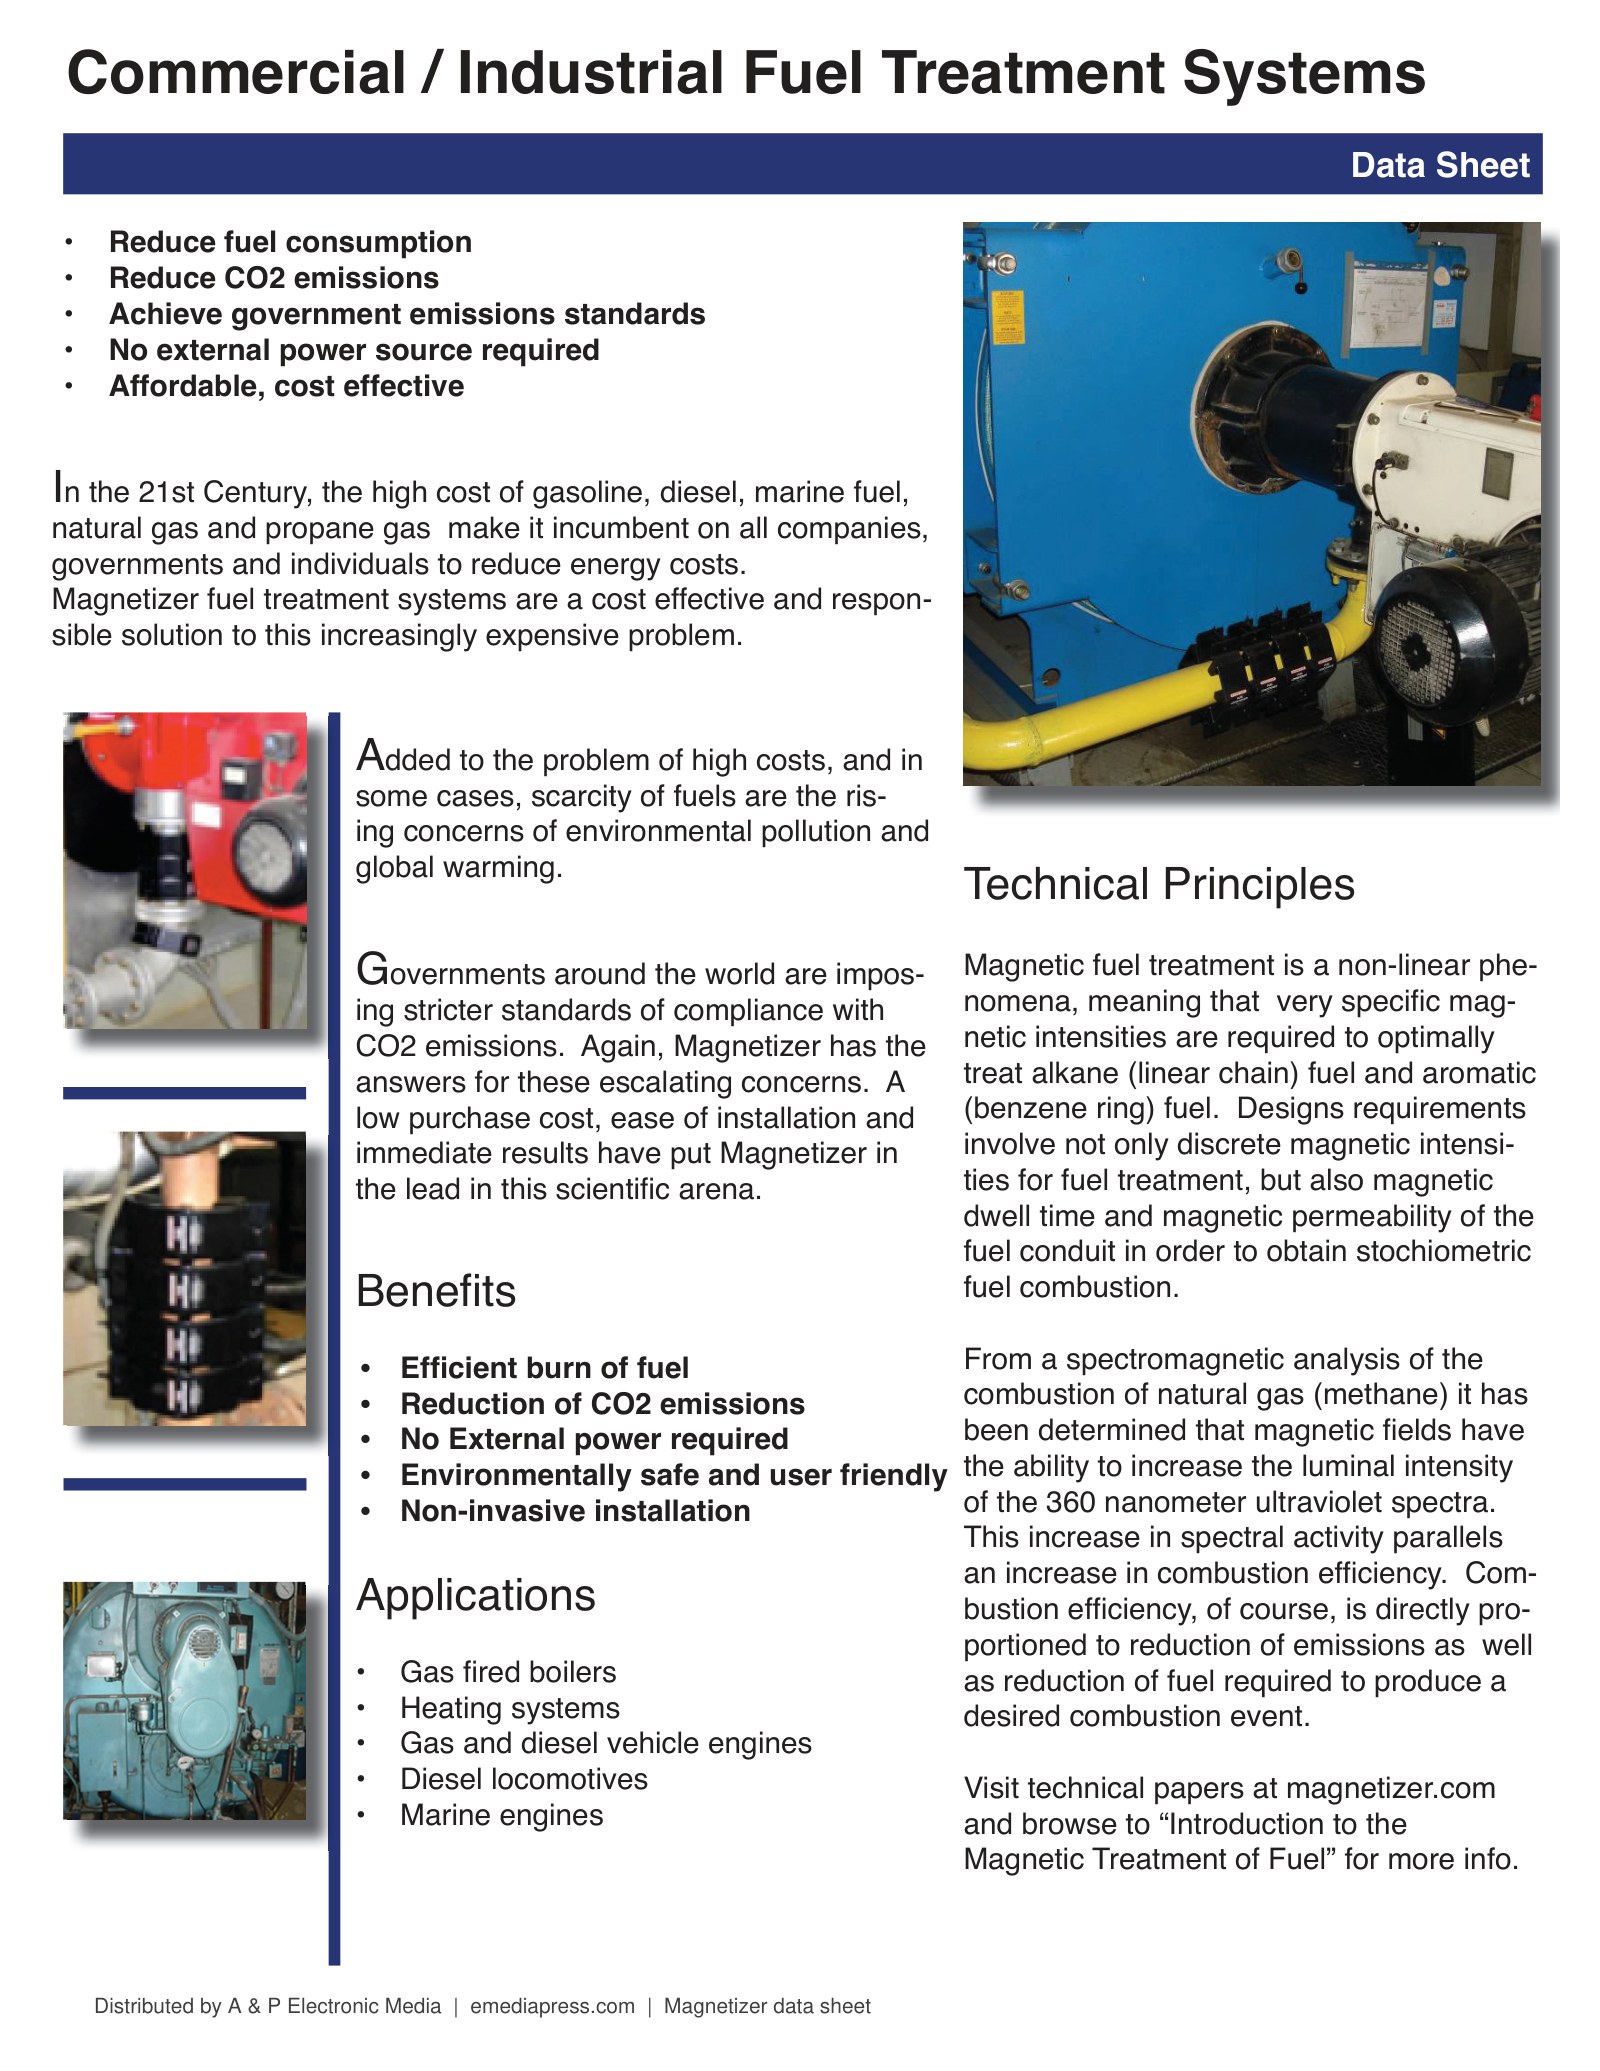
- Commercial / Industrial Fuel Treatment data sheet (1 page) — Commercial / Industrial Fuel Treatment (industrial, quoted) PDF · image






Videos (YouTube, channel “magnetizerproducts”)
- Magnetic Fuel Saver TV news story (News 8) (2 min 18 s) — local TV report on the fuel saver; the reporter relays the manufacturer’s claims YouTube
- Classic Magnetizer presentation on fluid conditioning (6 min 01 s) — 1980s manufacturer film on home water, pools and fuel YouTube
- Garrett Shivo interview, Product Prognosticator (3 min 13 s) — radio interview with Magnetizer’s CEO on the engine and home-water units YouTube
- New York Hilton, Chief of Operations (1 min 05 s) — hotel staff on the units feeding the rooftop cooling tower YouTube
- New York Hilton, Chief Engineer (1 min 50 s) — hotel chief engineer on cooling tower, chillers, heat exchanger and water supply YouTube
- Magnetizer slide presentation (music only, no narration) (10 min 02 s) — manufacturer slides: company background (0:25), water and fuel benefits (2:10), pools (5:10), automotive (5:40), industrial (7:25), oil line (7:55), refrigeration (8:25), agriculture (8:40) YouTube
Fuel, energy and scale results on this site are manufacturer test data or results reported by Magnetizer Inc., each linked to its source and dated. They are not a promise of what you will get. Results vary with the vehicle, appliance, fuel, water and installation.
Convinced? Pick your product
| Magnetizer Gasoline Performance Maximizer Item #5000 · Vehicles | Buy $198 |
| Magnetizer Diesel Performance Maximizer Item #5000D · Vehicles | Buy $198 |
| Magnetizer Motorcycle Energizer Item #5055 · Vehicles | Buy $60 |
| Magnetizer Natural Gas Fuel Maximizer Item #5560 · Home heating & appliances | Buy $198 |
| Magnetizer LPG Fuel Energizer Item #5530 · Home heating & appliances | Buy $198 |
| Magnetizer Home Fuel Oil Energizer Item #5500 · Home heating & appliances | Buy $100 |
| Magnetizer Home Refrigerator Energizer Item #R1002 · Home heating & appliances | Buy $60 |
| Magnetizer Home Hard Water Conditioner Item #4520 · Water | Buy $198 |
| Magnetizer Pool & Spa Conditioner Item #4565 · Water | Buy $198 |
| Magnetizer Flav-O-Ring Item #8000 · Gift | Buy $60 |
Shipping calculated at checkout on emediapress.com. Commercial and industrial systems are quoted separately — request a quote.
Peer-Reviewed Research on Permanent-Magnet Treatment (2016–2025)
The studies below were not performed with Magnetizer® products. They were conducted by independent university and industry researchers using other permanent (neodymium/NdFeB) magnets — not electronic or pulsed devices — and published in peer-reviewed scientific journals. We list them because they independently support the science behind the method Magnetizer uses: passing water or fuel through a strong permanent magnetic field.
Results in these studies vary with water chemistry, fuel, engine and installation. They are published findings, not guarantees of any particular result with any product.
Water & Scale
- Sohaili J. et al. (2016). “Removal of scale deposition on pipe walls by using magnetic field treatment and the effects of magnetic strength.” Journal of Cleaner Production 139: 1393–1399. doi:10.1016/j.jclepro.2016.09.028Finding: Permanent magnets (0.1–0.4 T) increased removal of existing scale from pipe walls by 46.7%.Independent study — not Magnetizer-brand equipment
- Bali M., Mabrouk Y., Abdelli N. (2016). “Effects of magnetic treatment on scaling power of hard waters.” Separation and Purification Technology 171: 88–92. doi:10.1016/j.seppur.2016.07.027Finding: Permanent magnets showed about 45% anti-scaling efficiency, with the effect persisting about 3 days.Independent study — not Magnetizer-brand equipment
- Simonič M., Urbancl D. (2017). “Alternating magnetic field influence on scaling in pump diffusers.” Journal of Cleaner Production 156: 445–450. doi:10.1016/j.jclepro.2017.04.080Finding: With a permanent magnet, hard adherent calcite scale was replaced by loose aragonite powder that flow flushed away.Independent study — not Magnetizer-brand equipment
- Gao F. et al. (2024). “Magnetization coupled reverse osmosis (RO): Enhanced inhibition scaling mechanisms and operation optimization.” Chemical Engineering Science 286: 119650. doi:10.1016/j.ces.2023.119650Finding: Neodymium magnets slowed membrane flux decline, improved recovery and shifted deposits to looser aragonite; effective above 0.24 m/s flow.Independent study — not Magnetizer-brand equipment
- Naderi M., Past V., Mahvi A.H. (2024). “Magnetic treatment as a suppressive method for CaCO3 scale deposition in hard waters in the presence of air bubbles.” Desalination and Water Treatment 318: 100249. doi:10.1016/j.dwt.2024.100249Finding: An NdFeB ring magnet shifted calcium carbonate to form in the water rather than on surfaces (statistically significant, p = 0.009).Independent study — not Magnetizer-brand equipment
- Zhang W. et al. (2025). “Magnetic field mitigation of composite fouling through microbial and interfacial disruption.” npj Clean Water 8: 104. doi:10.1038/s41545-025-00532-9Finding: Permanent magnets (300–800 mT) reduced fouling mass 18.6–36.2% in a reclaimed-water system (permanent-magnet results only; the paper also tests electromagnetic devices).Independent study — not Magnetizer-brand equipment
- Sayed A.A.M. et al. (2025). “Elucidating the Memory Effects of Magnetic Water Treatment via Precipitated Phase Changes of Calcium Carbonate.” Eng 6(2): 26. doi:10.3390/eng6020026Finding: A 700 mT neodymium magnet raised the softer vaterite form from 26% to 51% of precipitate, with smaller particles.Independent study — not Magnetizer-brand equipment
Fuel & Combustion
- Chen C.-Y. et al. (2017). “Impact of Magnetic Tube on Pollutant Emissions from the Diesel Engine.” Aerosol and Air Quality Research 17: 1097–1104. doi:10.4209/aaqr.2016.11.0478Finding: An NdFeB magnetic tube reduced fuel consumption about 3.5%, particulates 22–33% and hydrocarbons 29–65%; NOx rose 1–13%.Independent study — not Magnetizer-brand equipment
- Amini Niaki S.R. et al. (2020). “Experimental investigation of effects of magnetic field on performance, combustion, and emission characteristics of a spark ignition engine.” Environmental Progress & Sustainable Energy 39(2): e13317. doi:10.1002/ep.13317Finding: 9,000-gauss permanent magnets on a gasoline engine cut fuel use 4–12%, CO 11% and HC 18%.Independent study — not Magnetizer-brand equipment
- Arias Gilart R. et al. (2020). “Performance and exhaust gases of a diesel engine using different magnetic treatments of the fuel.” Journal of Mechanical Engineering and Sciences 14(1): 6285–6294. doi:10.15282/jmes.14.1.2020.07.0492Finding: NdFeB conditioners (0.36 T) cut fuel consumption 4.89% and CO about 21% at 80% load.Independent study — not Magnetizer-brand equipment
- Oommen L.P., Kumar G.N. (2020). “Experimental studies on the influence of axial and radial fields of sintered neo-delta magnets in reforming the energy utilization combustion and emission properties of a hydrocarbon fuel.” Energy Sources, Part A 46(1). doi:10.1080/15567036.2020.1767729Finding: Sintered NdFeB magnets on a gasoline engine raised power up to 9.2% and thermal efficiency up to 7.7%.Independent study — not Magnetizer-brand equipment
- Perdana D. et al. (2020). “The Role of Magnetic Field Orientation in Vegetable Oil Premixed Combustion.” Journal of Combustion 2020: 2145353. doi:10.1155/2020/2145353Finding: 1.1 T neodymium magnets on a burner improved flame stability and raised burning velocity and flame temperature.Independent study — not Magnetizer-brand equipment